2617 N. Fowler Ave, Fresno CA 93727
Phone (559) 292-3800 Fax (559) 292-4900
|
2617 N. Fowler Ave, Fresno CA 93727 Phone (559) 292-3800 Fax (559) 292-4900
|
|
|
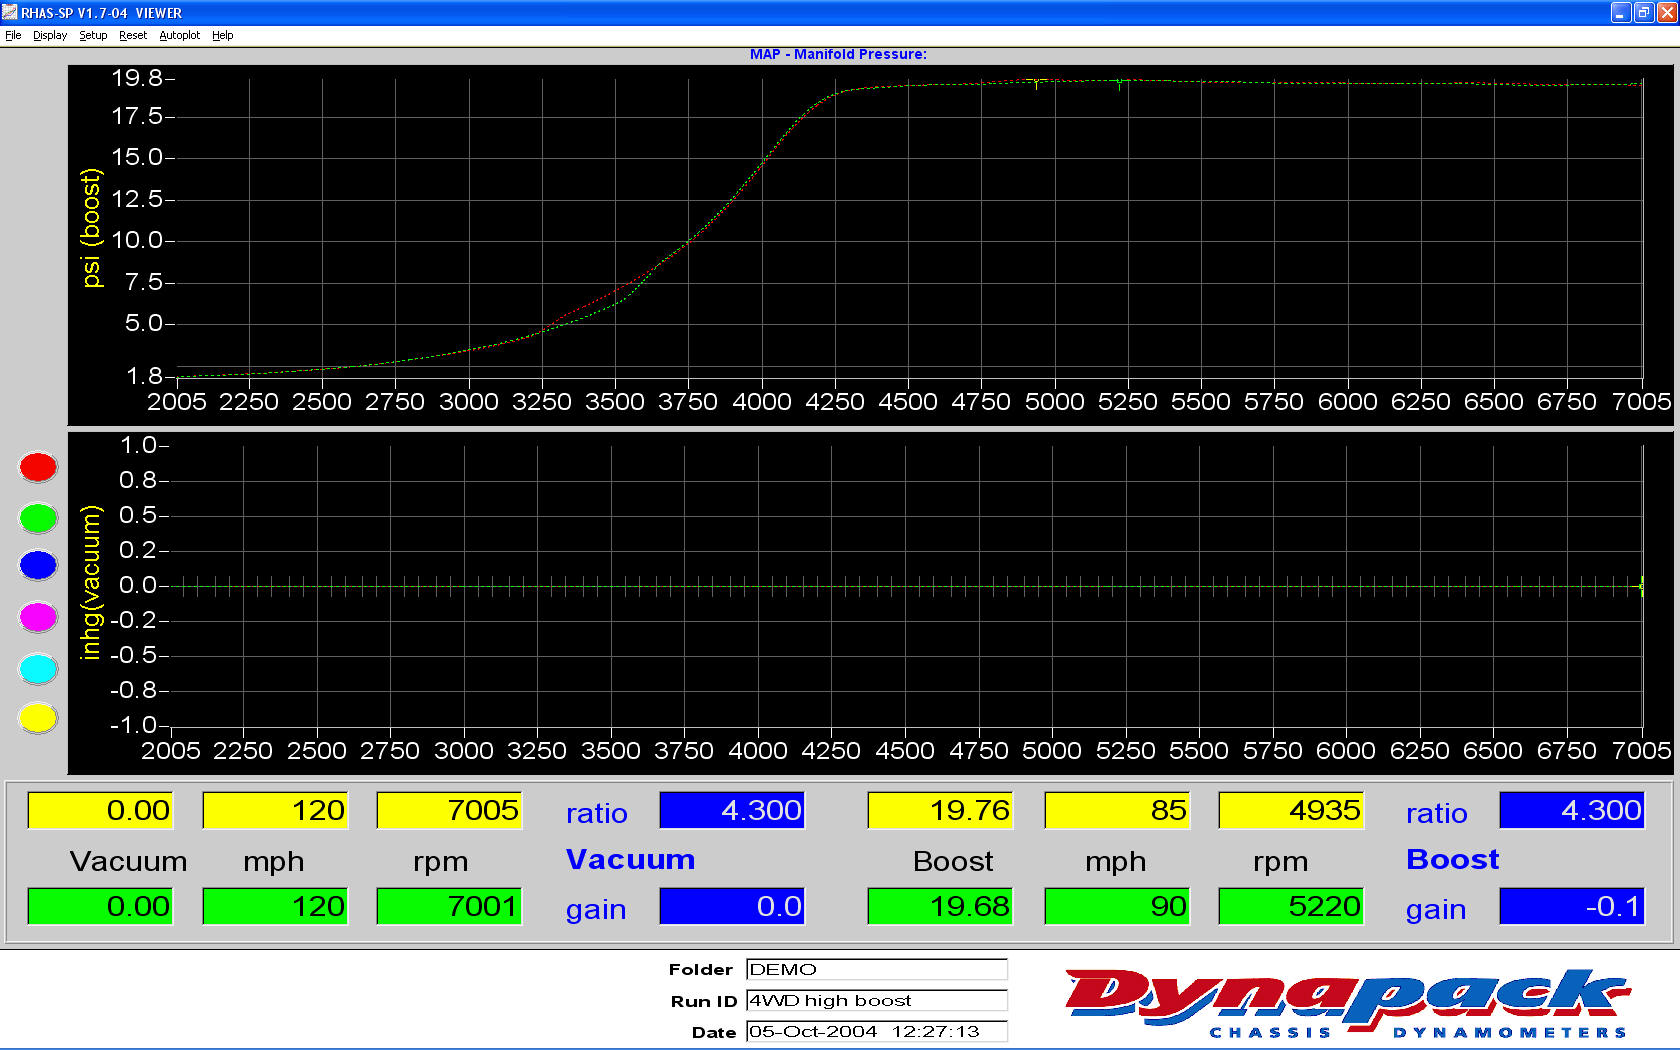
Vacuum / Boost Graph:
When the Vacuum / Boost sensor is connected to the vehicle, all of the readings will be sampled and graphed during an Autoplot (F1) run - like the example above. The split graph displays vacuum on the bottom graph, and positive pressure (boost) on the top graph - this allows the auto-scaling feature combined with the split graph gives you maximum resolution on both sides. If it were all on one graph, you may have 30 psi of boost, but only two inches of vacuum - and you would have very little resolution on the vacuum area. In the example above, the vehicle was in boost during the entire run. If any vacuum was seen, you would see the line transition from the bottom graph to the top graph at the RPM point where the transition occurred. As with the other graphs, runs are color coded according to the color bar on the left. |