2617 N. Fowler Ave, Fresno CA 93727
Phone (559) 292-3800 Fax (559) 292-4900
|
2617 N. Fowler Ave, Fresno CA 93727 Phone (559) 292-3800 Fax (559) 292-4900
|
|
|
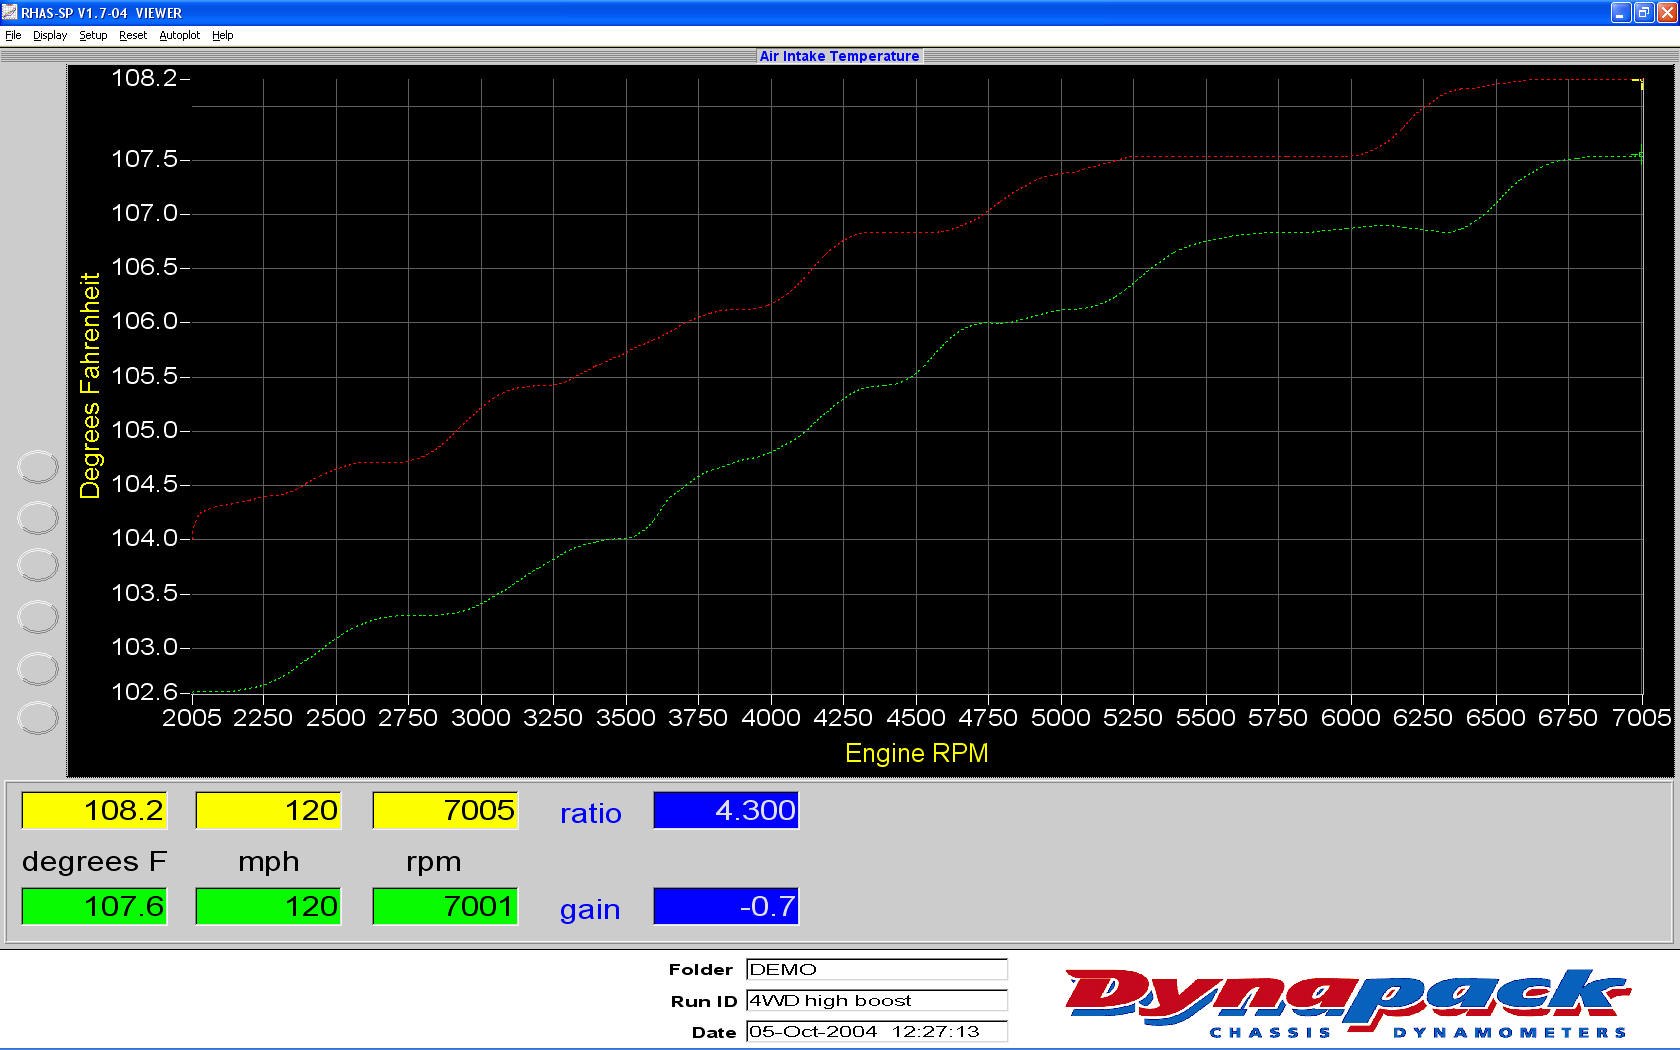
Temperature Graph:
The Temperature Graph displays the continuously measured temperature during the dyno runs. As with the other graphs, this graph is auto-scaling, so what may look like drastic differences in temperature, must be checked against the scale on the left - in this case, the difference was 1 -2 degrees through most of the run. |