2617 N. Fowler Ave, Fresno CA 93727
Phone (559) 292-3800 Fax (559) 292-4900
|
2617 N. Fowler Ave, Fresno CA 93727 Phone (559) 292-3800 Fax (559) 292-4900
|
|
|
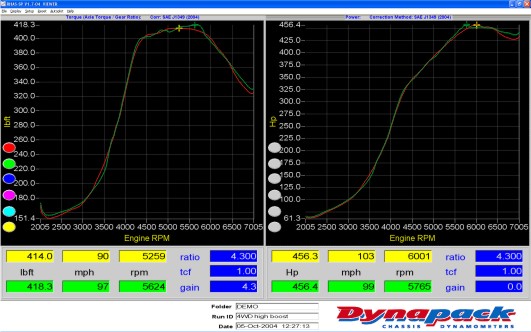
Power & Torque:
When an Autoplot (F1) run is completed, power and torque are displayed on a graph like the one shown above. In this example, multiple runs are shown and are color coded in the order shown on the left side of the screen - red for the first run, green for the second, etc. Peak numbers for both sides are displayed in the boxes below the graphs. Note that all of the graphs are auto-scaling, so the highest and lowest recorded numbers define the top and bottom of the graph - giving you maximum graphic resolution. |